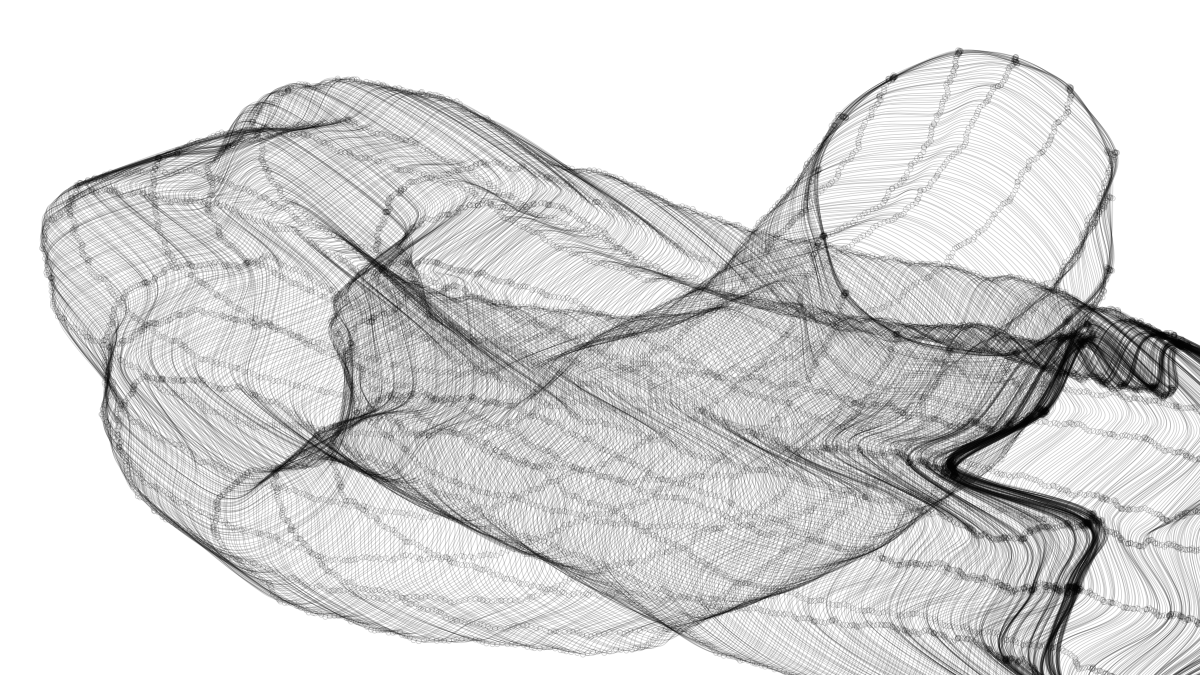
Generative Design with p5.js / Sketch P_2_1_5_04 を試しながらアレンジ。
元ネタ:https://editor.p5js.org/generative-design/sketches/P_2_1_5_04
今までで最大の難関。p5.vectorというものがどうも難しい。
新しく覚えたコマンドなど
p5.Vector
// A class to describe a vector.
// The datatype stores the components of the vector (x, y).
// The magnitude and direction can be accessed via the methods mag() and heading().
// We'll need to do some "vector" math for calculations, which is made easy by the methods inside the p5.Vector class.

createVector(x, y);
// Creates a new p5.Vector.

p5.Vector.dist(v1, v2);
// Calculates the Euclidean distance between two points (considering a point as a vector object).

p5.Vector.fromAngle(a);
// Make a new 2D vector from an angle

v.add(x, y);
// Adds x and y components to a vector.

v.rotate(a);
// Rotate the vector by an angle from origin.

beginShape();
curveVertex(x1, y1);
curveVertex(x2, y2);
curveVertex(x3, y3);
curveVertex(x4, y4);
endShape();
// Specifies vertex coordinates for curves.
// Is an implementation of Catmull-Rom splines.

redraw();
// Executes the code within draw() one time.
ロジックのポイント
描画済みの各曲線は配列shapesに格納されていて、draw()関数で毎フレーム描画されている。
  shapes.forEach(function(shape) {
    shape.draw();
  });
描画済みのものも描画中のものも、各曲線はそれぞれ配列shapePathであり、配列shapePathの要素はベクトル(座標)データになっている。
マウスが押されると、新しい曲線インスタンスnewShapeが生成され、マウスの座標からベクトルデータを作成して最初の配列要素としてpush()する。
その後、前の座標との距離がsmoothnessで定義した値を上回れば、新しい座標をpush()する。
この繰り返しで、配列shapePathの要素、つまり曲線のアンカーポイントのようなものが追加されていく。
function mousePressed() {
  newShape = new Shape(shapeHeight, shapeColor);
  newShape.addPos(mouseX, mouseY);
}
Shape.prototype.addPos = function(x, y) {
var newPos = createVector(x, y);
var lastPos = this.getLastPos();
if (
this.shapePath.length == 0 ||
lastPos && p5.Vector.dist(newPos, lastPos) > smoothness
) {
this.shapePath.push(newPos);
}
};getLastPos()は1つ前のベクトルデータを取得するためのメソッド。当然最初は空。
  Shape.prototype.getLastPos = function() {
    return this.shapePath[this.shapePath.length - 1];
  };
newShapeが存在する間、つまりマウスが押されている間は、リアルタイムでアンカーポイントを追加し、描画を更新し続ける。
  if (newShape) {
    newShape.h = shapeHeight;
    newShape.c = shapeColor;
    newShape.addPos(mouseX, mouseY);
    newShape.draw();
  }
曲線を描画する部分、draw()メソッド。
今の座標から前の座標を見た角度から長さ1のベクトルを生成。
平行線を描くために、Y軸方向に密度×n分シフトさせる。
次に先ほどの角度分回転させる。(これで平行線全体が揃って回転するようになる)
現在座標ベクトルと合成し、角度を加味した現在座標が完成する。
これをshapePathの要素分繰り返して曲線を描画し、平行線のうちの1本が完成。
事前に定義したshapeHeightに達するまでこれを繰り返すことで並行曲線が完成。
  Shape.prototype.draw = function() {
    stroke(this.c);
    for (var i = -this.h / 2; i < this.h / 2; i += density) {
      beginShape();
      this.shapePath.forEach(function(pos, index, shapePath) {
        var previousPos = shapePath[index - 1];
        if (previousPos) {
          var a = atan2(previousPos.y - pos.y, previousPos.x - pos.x);
          var offsetPos = p5.Vector.fromAngle(a);
          offsetPos.add(0, i);
          offsetPos.rotate(a);
          offsetPos.add(pos);
          curveVertex(offsetPos.x, offsetPos.y);
        }
      });
      endShape();
    }
  };
微小ベクトルを回転させて現在座標群を得るあたりはややこしくて自分で書ける気がしない。